Texas Government on Track to Spend $304 Billion a Year in 2026-27
Budget Gimmicks and Missing Money Hide the True Size of Texas Government
Executive Summary
The Texas budget is put together using smoke and mirrors. Everything about the appropriations process is designed to hide the total cost of government from Texas taxpayers and how much the cost increases each year.
Texas’ 2026-27 budget is no different. For instance, Senate Bill 1 and HB 500, the two primary appropriations bills this session, contain more than $48 billion of new spending. Yet the official documents of the Texas’ Legislative Budget Board (LBB) show only a $4.4 billion increase in total spending. The documents use accurate numbers but are highly misleading in how they are presented.
Another major problem with the Legislature’s budget documents are that they hide vast amount of spending controlled by the Texas Legislature. Tens of billions of dollars of health care, education, and other state-controlled spending simply do not exist according to state appropriations figures. Texans have no idea just how big Texas government really is.
This paper projects that annual state-controlled spending for the upcoming 2026-27 biennium will be about $305 billion, or $608 billion for the biennium. This is far different than the $337 billion biennial spending that shows up in the Legislature’s documents. The difference is calculated using three adjustments based on historical trends as explained below.
The size of government is inversely proportional to the freedom of citizens. The bigger the government, the more government interference in our lives and the less liberty we have. The findings of this report explains that the liberty Texans experience is much less than the official budget numbers suggest.
Initial Appropriations vs. Final Appropriations
Every session the Texas Legislature passes an appropriations bill. And every session the Texas Legislative Budget Board reports how much money is appropriated in the bill for the upcoming fiscal biennium. Then two years later the next session rolls around and the LBB reports that the appropriation for that biennium is actually more than was appropriated in the previous session.
There are several reasons for this, including estimated and supplemental appropriations that do not get counted the first time. The important thing to remember is that this always happens. At least, it has happened every session since 2003.
Figure 2 shows the difference between initial and final appropriations for each biennium since the 2012-13 biennium. The average increase each biennium over that period is $22 billion, or 8.99%.
Final Appropriations vs. Actual Spending
Texas Comptroller Glenn Hegar recently reported that the state of Texas spent $212 billion in FY 2024, an increase of 6.6% over the previous year.
However, the comptroller’s number is far higher than the number from the Legislative Budget Board, which show spending is closer to $172 billion for the year. Why the discrepancy?
It is because the LBB’s numbers—which are the ones that almost everyone uses—leave out significant amounts of state spending. The LBB only shows spending that is included in the appropriations bills each session. And the Legislature has excluded billions of dollars of spending from the appropriations process.
For instance, in 2013, the Texas Legislature decided to remove $6.1 billion in state spending from the Texas budget. It simply disappeared (which had the benefit of masking the large increases in spending authorized by the 83rd Texas Legislature). The missing money was largely expenditures of patient income generated by state university research hospitals. Today, that money is still being spent—and is likely a much larger amount of money. But it is not included in the LBB’s summaries of appropriated state funds.
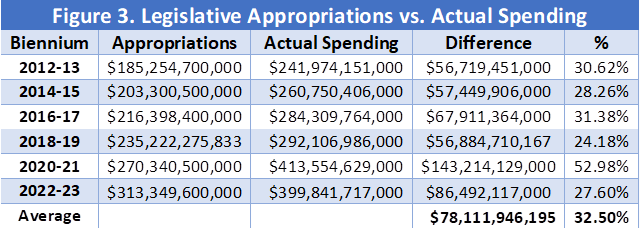
Figure 3 shows the discrepancy of biennial state spending as reported by the comptroller and the LBB’s appropriations numbers. On average, the state spends 32.5% more every biennium than what is shown in the LBB’s numbers.
State Education Spending vs. Total Education Spending
The largest spending item in the Texas budget is public education, projected to cost about $101 billion in the 2026-27 biennium. But that amount does not tell the complete story. Total spending on government schools and the education bureaucracy is much higher when including both state spending and state-controlled local spending.
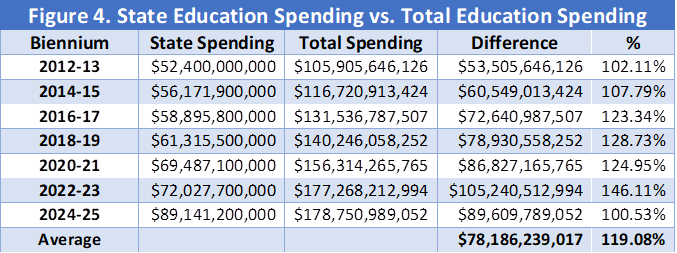
Figure 4 shows the difference between state spending on public education in Texas and total spending on public education in Texas. One difference between the two is that some federal funds flow directly to local schools and bypass the state. But the primary difference is the spending of local property tax revenue. Recaptured property tax revenue is included in the state budget numbers, but most spending of property tax revenue is not included in the state budget. That number is substantial. In the 2024-25 biennium school property tax revenue was $81.5 billion, which explains most of the $89 billion difference between state and total spending. On average, total education spending is 119% higher each biennium than state education spending.
The reason for including total education spending under state-controlled spending is straightforward. The state of Texas is in total control of local school spending. This did not use to be the case. But starting in the mid-1980s the state began its takeover of local schools; by the end of the 1990s the conquest was complete. The state controls all education spending through its funding formulas. While not all property tax revenue flows through the state, all of it is accounted for in the state funding formulas. Additionally, the state controls how much property tax revenue school districts can raise (although they do a poor job of it). Schools get to set their own budgets, but the total amount of education spending is controlled by the state of Texas.
Projected State-Controlled 2026-27 Spending
With this background, we are now able to estimate the total amount of spending controlled by the state of Texas during the upcoming 2026-27 fiscal biennium.
While we do not have a final number for the 2026-27 appropriations bill, the House version of Senate Bill 1 that recently passed appropriated $337.4 billion of all funds spending for the upcoming biennium.
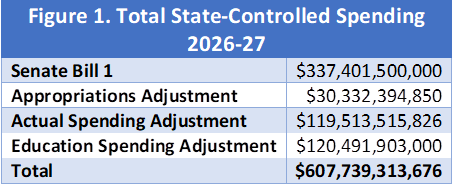
Figure 1 shows the total projected amount of state-controlled spending for the 2026-27 biennium. Adjusting the $337.4 billion of appropriated funds for the average historic difference between initial appropriations and final appropriations, 8.99%, adds $30.3 billion. Next, adjusting for the average historical difference between final appropriations and actual spending, 32.5%, adds $119.5 billion. Finally, adjusting for the average historical difference between state public education spending ($101.3 billion for 2026-27) and total education spending adds $120.5 billion. The total projected state-controlled spending for 2026-27 is $607.7 billion, an average of almost $304 billion a year, 80% more than is shown in the Legislature’s official budget documents.


